If you are dealing with a huge network of hosts, it’s chaotic to deal with the entire traffic and bandwidth issues. At times, it gets hard to troubleshoot an issue with a dead node. In those cases, a good networking app really helps. Apart from these, even if you are beginning in network administration, it would be good to have a hands-on with these tools on your home network. Here are some of the best networking apps for Linux from a whole sea of Linux networking tools.
If you are getting started, here is a quick cheat sheet to keep track of the most basic to advanced top 50 Linux networking commands and its uses.
Best Networking Apps for Linux
1. nmap
The most basic command-line network scanning tool you should start with is nmap. It is an open-source tool and if put in simple words, discovers open ports on hosts in your network. For instance, we have a WD NAS drive and I want to figure out the open ports on the device. I can simply use the nmap command followed by the IP address and below is the command output. I have my SSH, MySQL, and other ports open on the NAS. nmap just sends raw packets to the system ports to identify the active ports on the network device.
The purpose of nmap is to identify the vulnerable ports and security loopholes in the network. Similar to nmap, Netcat is another port scanning tool. Apart from that, it can do additional tasks like port redirection, open remote connections, etc.
What’s good?
- Minimum configuration required to start with
- Scan entire network hosts and ports to detect vulnerabilities
- Ability to detect services and host types in the network
Visit nmap GitHub

2. Quagga
Unlike nmap, Quagga is a more advanced command-line tool. It is a fork of the deprecated GNU Zebra IP routing tool. Zebra was a popular tool that provided you the functionality of converting your server into a full-fledged router. Quagga is also built on the same lines. The Quagga architecture consists of a core daemon, zebra, which acts as an abstraction layer to the underlying Unix kernel and presents the Zserv API over a Unix or TCP stream to Quagga clients. Overall, it supports 5 basic routing protocols – ospf, ospf6d, ripd, ripngd, bgpd.
What’s good?
- Convert your server into a full-fledged router
- Supports 5 routing protocols like ospf, bgp, rip, etc
- Ability to filter and manage routes, redirect packets, etc
Download Quagga
3. Cacti
From the command-line tools, let’s move to some GUI-based networking tools. Cacti is a front-end to the existing RRD (Round Robin Database) tool present in Linux. The frontend is completely based on PHP and it stores the networking data in MySQL. So, as a pre-requisite, you need to have PHP, MySQL, Apache/lighthttpd, RRDTool, and SNMP configured and installed. Additionally, the client devices need to have Cacti client tool installed for the Cacti server to communicate with them.
My most favorite thing about Cacti is the unlimited graphical representation of data from multiple data sources. The tool inherently uses rrdtool to create and update command to create network monitoring graphs. Cacti has a built-in MRTG (Multi Router Traffic Graphing) module that can track and measure router traffic like process time on a server, lost packets, actual network traffic, etc. It also has inbuilt graph templates which helps to group multiple graphs together and have a comparitive data.
What’s good?
- Network monitoring tool with unlimited graphic representation of data
- Combine graphs and data from multiple hosts
- Inbuilt graph templates for better data representation
- Generate alerts based on network downtime, dead host, etc
Download Cacti

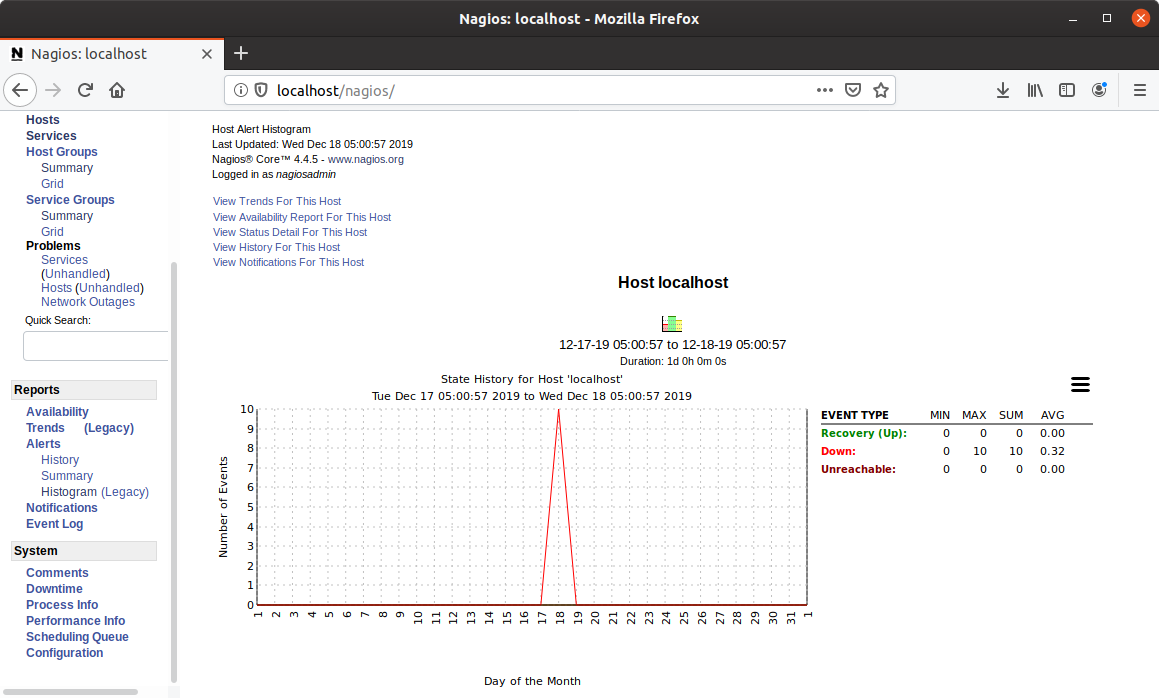
4. Nagios Monitoring
Nagios is another leading open-source networking tool for Linux. It provides a web portal interface which lets you manage and monitor hosts on your router or switches. Similar to Cacti, you would require PHP, Apache, MySQL configured and running on your Linux server. The major distinguishing factor between Cacti and Nagios Core is the availability of plugins and handling of SNMP monitoring. Nagios Core is mostly based on real-time monitoring of events and notifying alerts based on them.
Nagios Core is quite a complex tool to use and the interface doesn’t really help. Most of the development is directed towards the paid Nagios XI tool. Having said that, there are tons of documentation present on the site to help you out. Unlike Cacti, Nagios Core cannot create complex graphs and wouldn’t be helpful in terms of plotting various host data on a graph.
What’s good?
- Alerts to inform about network events, downtime, etc
- Availability of plugins for Nagios core to enhance functionality
Download Nagios Core
5. Icinga
Icinga is a fork of Nagios Core and hence all the plugins and add-ons made for Nagios Core would work even on Icinga. However, the UI and web interface feels more responsive than Nagios as it has been developed as a seperate entity. Similar to the above tools, Icinga provides monitoring of hosts and their resources. You can create alerts for outages and performance graphs. You can automate Icinga to send emails within a specified period of time. Compared to Nagios Core, the Icinga setup is much more intuitive and easy.
There is also an updated paid variant called Icinga 2 which supports REST APIs to easily send data to other web servers.
In case you have permissions issues on the icinga web dashboard, make sure appropriate permission is provided to the user account in /etc/icinga/cgi.cfg file
What’s good?
- Fluid interface compared to Nagios Core and Cacti
- CPU, Storage, and resource information of the hosts
- Supports REST APIs to send and receive data from other web services
Download Icinga

6. LibreNMS
LibreNMS has a refreshing interface and functionality when compared to the above-mentioned tools. The interface is quite clutter-free and is easier for a beginner to understand. The alerting system supports emails as well as Slack which is a novel feature. Apart from these, you also get an Android and iOS app with basic core functionality to monitor the network. It also provides API so it is easy to integrate the networking data or reports generated by LibreNMS in your internal server scripts or programs. You can also add or update your hosts list on the LibreNMS server by passing the data via JSON files.
What’s good?
- Alerting system based on Email, IRC, Slack
- LibreNMS APIs to performance updation via scripts and programs
- REST APIs to share data with other web services
- Android and iOS app for monitoring the network
Download LibreNMS

Download LibreNMS
Closing Words
I would recommend you to start out with nmap and gradually move towards LibreNMS or Icinga to understand networking, ports, port forwarding, etc. Nagios and Cacti are good open-source freeware to monitor your home network devices. For more queries or issues regarding setup of networking tools, let me know in the comments below.
Also Read: 7 Best Open Source Network Monitoring Tools